How I build a tool to visualize todo lists
This the technical part of The 1 tool you'll ever need to improve your results (opens new window). This just my take on how I went thorugh implementing hill chart for me to use freely in my projects.
I love this game (Hill climb racing) BTW, but I'll choose another way to implement hill charts using D3.js (opens new window) a javascript data visualization library.
Since we'll deal with charts and math Let's start by this equation.
const hillFn = (point) =>
  50 * Math.sin((Math.PI / 50) * point - (1 / 2) * Math.PI) + 50;
Woh! that's looks complicated I know, this function is responsible for produce hill-like curve and, correctly position and drag points on the curve.
I used Desmos (opens new window) to visualize above equation on the curve.
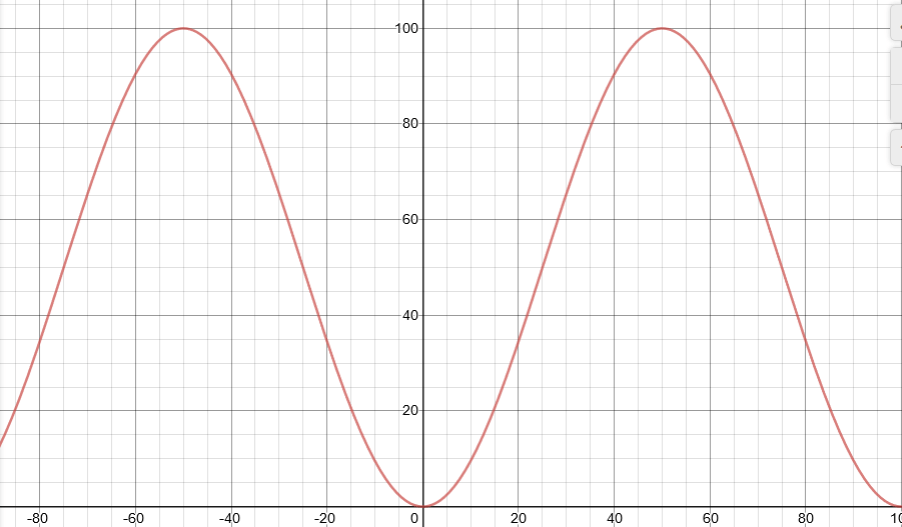
Now we have ourselves a hole not a hill but we'll fix that.
    // Set X and Y axis scale values, it used to determine the center of the chart
    // when calling this.xScale(50), it also flip the y axis to start from the
    // lowest point and scale up like claiming a hill from the ground.
    this.xScale = scaleLinear().domain([0, 100]).range([0, this.chartWidth]);
    this.yScale = scaleLinear().domain([0, 100]).range([this.chartHeight, 0]);
this.chartWidth could be any width.
One of the most powerful features in d3js is scaleLinear domains. In this implementation d3 will represent ranges from 0 to chart width in domain (scale) from 0 to 100 where 0 is the beginning of the chart and 100 is the end and 50 is the hightest point, no matter the width or the hight of the chart.
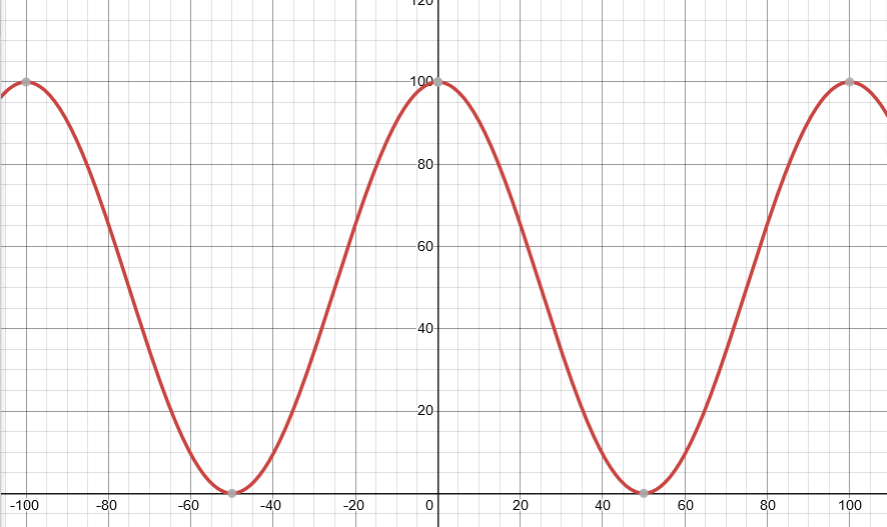
in the second line we flipped the range so that the y axis to start from the lowest point and scale up like claiming a hill from the ground. it's like adding minus sign before the equation.
const hillFn = (point) =>
  -1 * (50 * Math.sin((Math.PI / 50) * point - (1 / 2) * Math.PI) + 50);
# Normalizing points
Because every point on the hill chart can be represented as value from 0 to 100 on the X axis, end-user may enter a point x coordinates on the chart and the hillfn will take care of converting it to actual (x, y) pair on the chart.
// Example of point
  {
    id: '3' // (optional)
    color: 'red',
    description: 'Late af task',
    size: 10,
    x: 45,
    link: '/fired.html',
  }
# Points can climb hills
While implementing dragging points, I faced problem of converting new coordinates (x, y) pair to scale values from 0 to 100.
x axis value on the chart which represented by data.x is taking the mouse x axis event value, while it can't move freely on y axis according to the mouse coordinates, so in order to get y axis value we need to get the invert of scale x value and pass it to hillfn which will get the scale y. For example
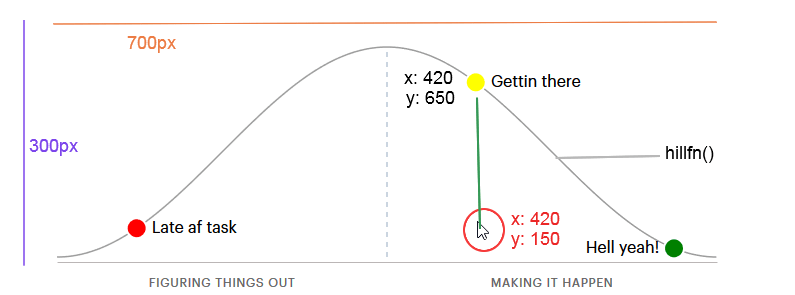
In this example x coordinate of the mouse equals the yellow point x coordinate on the chart, to get y yScale(hillFn(invertedX))
      // Convert current point coordinates back to the original scale
      // between 0 and 100 to set it in the data attribute
      const invertedX = that.xScale.invert(x);

      // move point on x axis
      data.x = x;

      // Explained above
      data.y = that.yScale(hillFn(invertedX));
After climbing that hill (dragging), a user may want to know new point coordantes that's when I faced another problem of converting y point to scale Y point so user can save it to database.
I had to find the reverse of hillfn
// The inverse of hillfn() convert values from chart coordinates
// back to the original scale hillFn() value. mainly used
// in dragging event and setting the setting new values.
const hillFnInverse = (point) =>
  (25 * (2 * Math.asin((point - 50) / 50) + Math.PI)) / Math.PI;
Now we can convert point coordinates on chart to scale pair
      const invertedY = hillFnInverse(that.yScale.invert(data.y));

      const newInvertedCoordinates = {
        x: invertedX,
        y: invertedY,
      };